
When I self-host services, I do not want to discover downtime by opening the site manually. I want a small page that tells me what is failing and a notification when I am not looking at it.
Gatus fits that job well: it stores uptime history, checks endpoints on a schedule, and can alert Slack. I run it in Docker and put Caddy in front when the dashboard needs to stay private.
What I Want From The Monitor
The setup below covers the checks I usually care about:
- the HTTPS endpoint returns
200 - the response body contains something expected
- the certificate is not close to expiring
- HTTP still redirects to HTTPS
- DNS resolves independently from the web check
- Slack gets an alert only after repeated failures
Setting up Gatus with Docker
My base Docker Compose file is small:
services:
  gatus:
    image: twinproduction/gatus:latest
    container_name: gatus
    restart: unless-stopped
    ports:
      - "8080:8080"
    volumes:
      - ./config:/config
      - gatus_data:/data
    environment:
      - GATUS_CONFIG_PATH=/config/config.yaml

volumes:
  gatus_data:
The gatus_data volume persists the SQLite database, so uptime history survives container restarts. I keep the config in a local ./config directory because it makes changes easy to review in Git.
Create the config directory and start with one endpoint:
mkdir -p configstorage:
type: sqlite
path: /data/data.db
web:
port: 8080
endpoints:
- name: "My Website"
url: "https://example.com"
interval: 5m
conditions:
- "[STATUS] == 200"
- "[RESPONSE_TIME] < 5000"
- "[CERTIFICATE_EXPIRATION] > 720h"Start it up:
docker compose up -dOpen http://localhost:8080 and the first endpoint should already be visible in the dashboard.
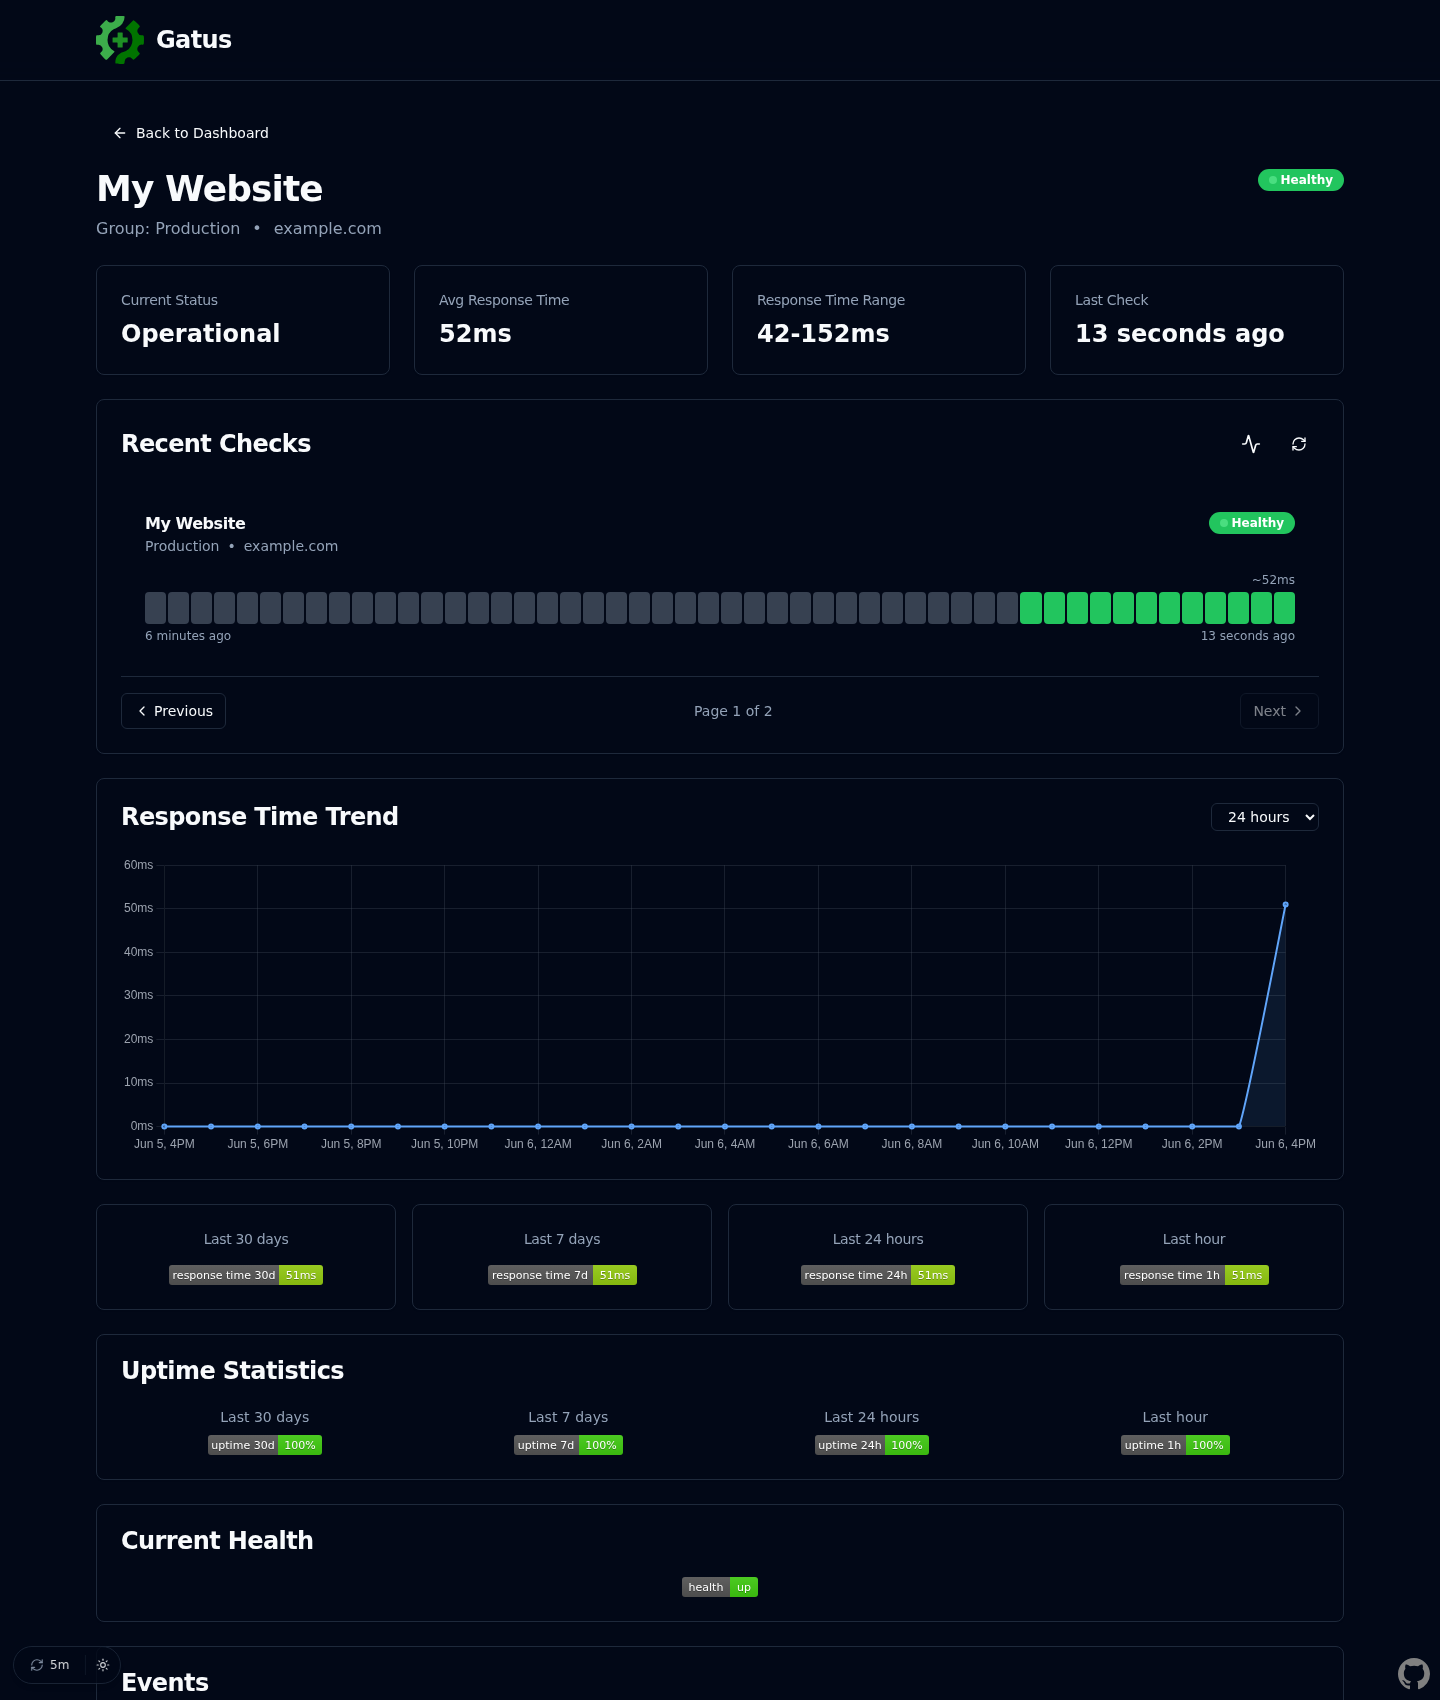
After a few runs, the endpoint detail page gives me the current status, recent checks, response-time trend, uptime badges, and event history in one place:
About the conditions
Each condition is evaluated independently.
[STATUS] == 200checks the HTTP status code,[RESPONSE_TIME] < 5000checks that the response comes back in under 5 seconds, and[CERTIFICATE_EXPIRATION] > 720hwarns you if the SSL certificate expires in less than 30 days.
Types of checks
A basic HTTPS check tells me if the site responded, but not whether it responded with the page I expected. These are the checks I normally add after the first one works.
Body validation
A site can return 200 while showing an error page, a maintenance screen, or a blank response. Checking for a known string catches some of those cases:
- name: "My Website"
  url: "https://example.com"
  interval: 5m
  conditions:
    - "[STATUS] == 200"
    - "[BODY] == pat(*example*)"
    - "[RESPONSE_TIME] < 5000"
    - "[CERTIFICATE_EXPIRATION] > 720h"
Watch out
It’s not
containsGatus usespat()for pattern matching, notcontains. The syntax is[BODY] == pat(*text*)where*is a wildcard. This is also case-sensitive, so make sure the text matches exactly what’s in the HTML. Using the domain name (e.g.,example.com) is a safe bet since it’s usually present in links and meta tags.
HTTP to HTTPS redirect
If a service should only be accessed through HTTPS, I also check the plain HTTP URL and expect a redirect:
- name: "My Website (HTTP→HTTPS)"
  url: "http://example.com"
  client:
    ignore-redirect: true
  interval: 15m
  conditions:
    - "[STATUS] == any(301, 302, 308)"
You must disable redirect following
By default, Gatus follows redirects automatically. Without
ignore-redirect: true, it would follow the redirect to the HTTPS version and report 200 instead of the redirect status code. This one caught me off guard. The property name isignore-redirect, notfollow-redirects.
308 Permanent Redirect
Some web servers (like Caddy) return 308 instead of 301. The difference is that 308 preserves the HTTP method during the redirect. Check what your server returns and include it in the condition. Using
any(301, 302, 308)covers all common redirect codes.
DNS resolution
DNS can fail while the server itself is fine. When that happens, the HTTPS check only tells you that the site is unreachable. A dedicated DNS check points at the real layer that broke:
- name: "My Website DNS"
  url: "8.8.8.8"
  dns:
    query-type: "A"
    query-name: "example.com"
  interval: 5m
  conditions:
    - "[DNS_RCODE] == NOERROR"
The URL is the DNS server, not the domain
The
urlfield is the DNS server to query (like8.8.8.8for Google’s public DNS), not the domain you want to check. The domain goes indns.query-name. If you put the domain inurl, you’ll get a crypticunknown porterror.
My starting template
This is the template I start from for a single public site:
storage:
  type: sqlite
  path: /data/data.db

web:
  port: 8080

endpoints:
  - name: "My Website"
    group: "Production"
    url: "https://example.com"
    interval: 5m
    conditions:
      - "[STATUS] == 200"
      - "[BODY] == pat(*example*)"
      - "[RESPONSE_TIME] < 5000"
      - "[CERTIFICATE_EXPIRATION] > 720h"

  - name: "My Website (HTTP→HTTPS)"
    group: "Production"
    url: "http://example.com"
    client:
      ignore-redirect: true
    interval: 15m
    conditions:
      - "[STATUS] == any(301, 302, 308)"

  - name: "My Website DNS"
    group: "Production"
    url: "8.8.8.8"
    dns:
      query-type: "A"
      query-name: "example.com"
    interval: 5m
    conditions:
      - "[DNS_RCODE] == NOERROR"
Use groups
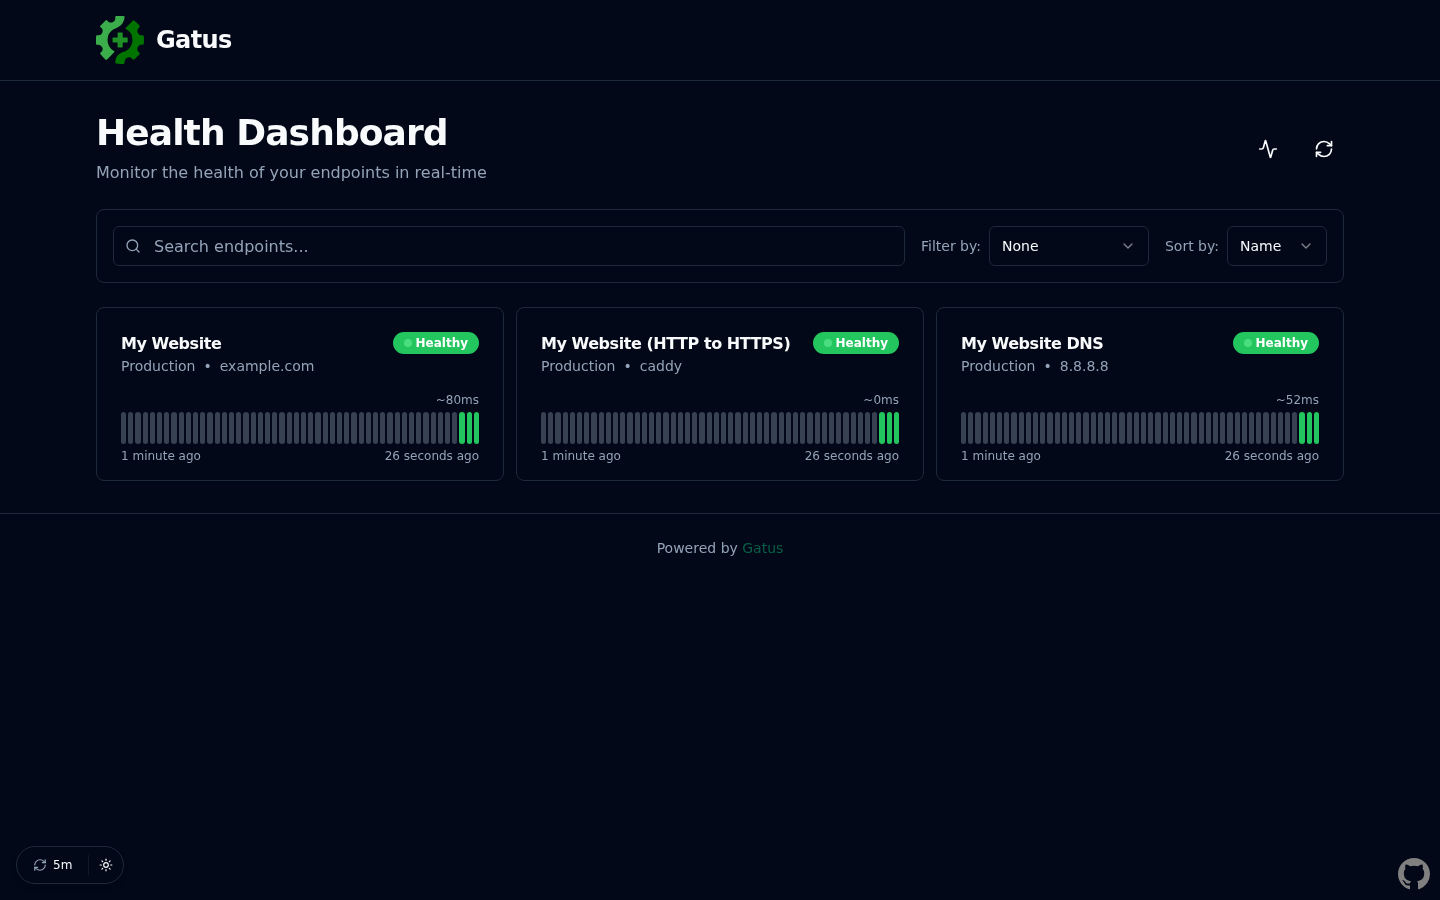
The
groupfield organizes your endpoints in the dashboard. I use it to group by project or client, so you can quickly see which group has issues at a glance.
With the HTTPS, redirect, and DNS checks in the same group, the dashboard becomes a quick “is production healthy?” page:
Slack alerts
Without alerts, I only notice the dashboard when I remember to open it. Slack notifications make Gatus useful when I am not looking at it:
alerting:
  slack:
    webhook-url: "https://hooks.slack.com/services/YOUR/WEBHOOK/URL"
    default-alert:
      description: "Monitoring alert"
      send-on-resolved: true
      failure-threshold: 3
      success-threshold: 2

endpoints:
  - name: "My Website"
    url: "https://example.com"
    interval: 5m
    alerts:
      - type: slack
    conditions:
      - "[STATUS] == 200"
The default-alert block sets the defaults I usually want for all alerts:
failure-threshold: 3means it only fires after 3 consecutive failures, avoiding false positives from a single timeoutsuccess-threshold: 2marks the issue as resolved after 2 consecutive successessend-on-resolved: truesends a follow-up notification when the issue is fixed
To get a Slack webhook URL, create an app in your Slack workspace, enable Incoming Webhooks, and copy the generated URL.
Each endpoint opts in with alerts: - type: slack. I like that because not every check deserves a notification; some are useful only as dashboard context.
Protecting with Caddy
If the dashboard is exposed on a public domain, I do not leave it open. The smallest setup I use is Caddy with basic auth. If you’re not familiar with Caddy yet, check out how to set up local certificates with mkcert and Caddy.
First, generate a bcrypt password hash:
docker exec -it caddy caddy hash-password --plaintext "your-password-here"This outputs something like:
$2a$14$ffmJ6UzMigRLhWVr4.NN1ep7TBcvDvqnNeMABAr1W11VpSzBaCT9iThen add it to your Caddyfile:
uptime.example.com {
    basic_auth {
        youruser $2a$14$ffmJ6UzMigRLhWVr4.NN1ep7TBcvDvqnNeMABAr1W11VpSzBaCT9i
        anotheruser $2a$14$mKnIWye49BDwlOuhk6zuFuqKARrtxYE3YYlIhFDcK6BX4acVapWy2
    }

    reverse_proxy gatus:8080
}
If you’re using this approach, remove any security block from the Gatus config since Caddy is handling authentication. This also means Gatus doesn’t need to expose port 8080 publicly, just to the Caddy network.
Shared Docker network
For
reverse_proxy gatus:8080to work, Gatus and Caddy must be on the same Docker network. If Caddy runs in its own Compose stack, create an external network and add both services to it. Without this, Caddy can’t resolve thegatushostname.
Update the Docker Compose to only expose the port internally:
services:
  gatus:
    image: twinproduction/gatus:latest
    container_name: gatus
    restart: unless-stopped
    expose:
      - "8080"
    volumes:
      - ./config:/config
      - gatus_data:/data
    environment:
      - GATUS_CONFIG_PATH=/config/config.yaml

volumes:
  gatus_data:
Basic auth limitations
Basic auth is secure over HTTPS (Caddy handles TLS automatically), and the passwords are stored as bcrypt hashes. The limitation is convenience: no logout button, no 2FA, and the browser shows its native login popup. That is enough for my monitoring dashboard. If you need proper sessions with logout, look into Authelia or OAuth2 Proxy.
Comments